
Description
Abstract
This paper provides information about the pattern of rainfall meteorological drought of Chamarajanagar district from 2001 to 2020. Rainfall is key factor to determine the meteorological drought. Rainfall is temporally and spatially very important for the welfare of the national economy. The average annual rainfall of any region is shows that the spatial variations. To identify the trend and pattern of rainfall analysis data has been collected from Indian Meteorological Department from 2001 to 2020 and Standardised Precipitation Index (SPI) has used for analysing the meteorological drought condition, and based on SPI value Chamarajangar district has experienced moderate drought condition from 2001 to 2020.
Introduction
Rainfall the primary factor to determine the sustainability and conservation of biodiversity means different living species on the earth. There is a large variation of rainfall distribution in both regional and temporal. Rainfall is the necessary meteorological parameter to describing the monsoon climate and it is a major component of the hydrological cycle of the earth ‘s climate structure. In India more than 75percent of rainfall in monsoon season from June to September, because the India is lying in tropical country and where water utilization completely depends on monsoon rainfall for the agricultural practices.
Objective
Chamarajanagar district belongs under southern zone of dry agro-climatic zone with geographical area of 569901 hectares. It lies between from 11º40'58'' to 12º06'32'' of North latitude and from 76º 24' 14'' to 77º 46' 55'' of East longitude. The Chamarajanagar district is stretched out in east – west direction. It comprises totally 5 taluks are Chamarajanagar, Gundlupet, Kollegal, Hanur and Yalandur and consists of 16 hoblies, 428 inhabited villages and 81 uninhabited villages.
Materials and Method
To analyse and measure the meteorological drought from 2001 to 2020 in Chamarajanagara district Standardized Precipitation Index has used. Rainfall data has been collected from Indian Meteorological Department.
Results and discussion
To analyse the rainfall pattern 20 years has taken from 2001 to 2020 rainfall data from different rain gage stations of Chamarajanagar district. To study the trend and pattern of rainfall of the study areas rainfall has analysed season wise along with annual average rainfall
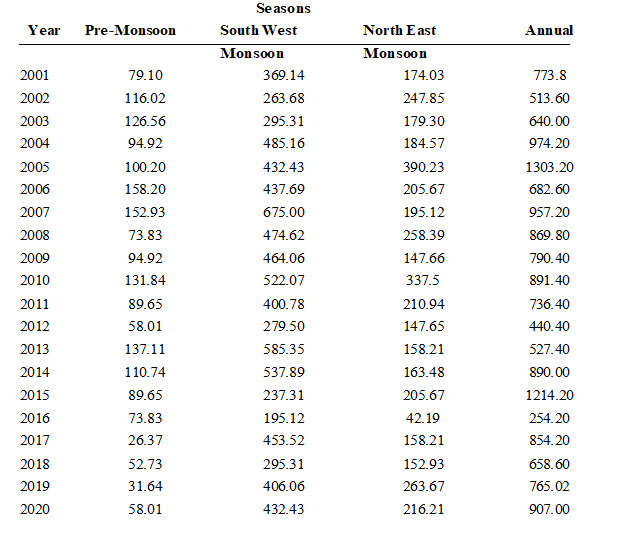
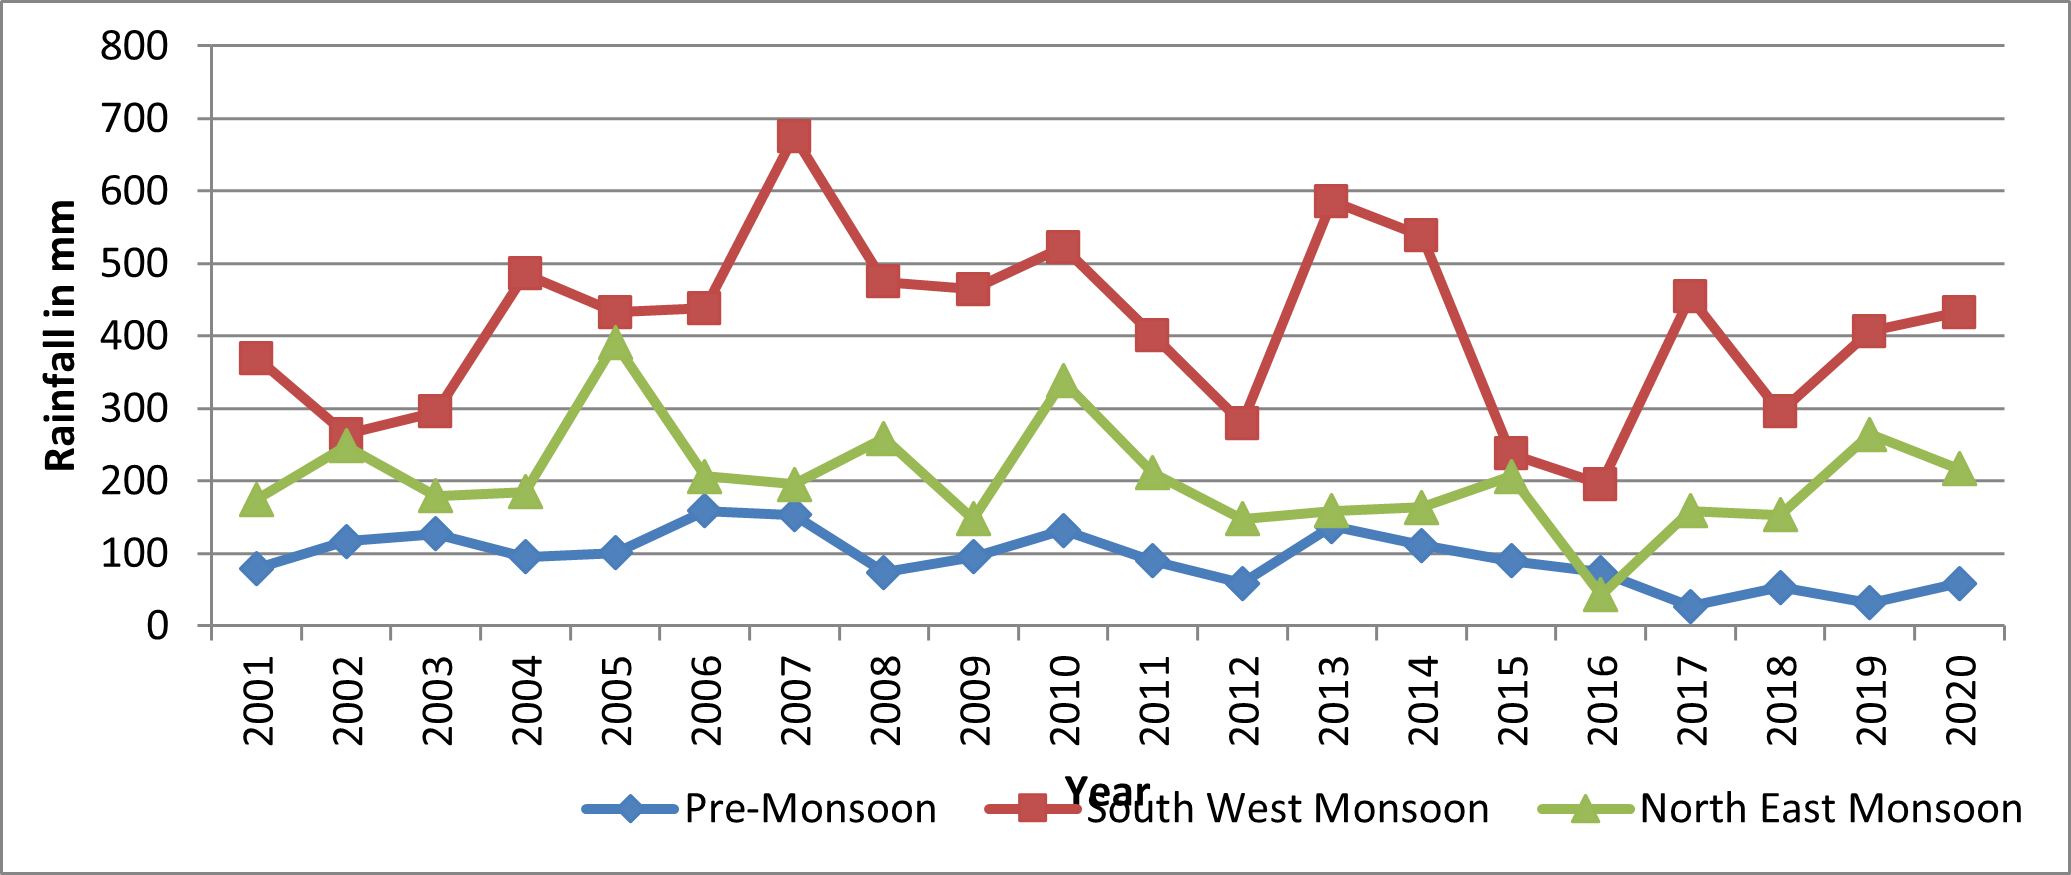
Pre-Monsoon: Pre monsoon season starts in March and ends in the month of May. This pre monsoon season is the onset period for monsoon in the study area and it contributes only 10 % of rainfall in the annual total. In this pre monsoon season district receives highest rainfall (158.20 mm) in the year 2006 and lowest rainfall (26.37 mm) in 2017
Southwest Monsoon: Monsoon season starts from June and continues up to end of September, total district receives highest amount of rainfall in these four month, and it contributes 74 % of rainfall in the annual total. In the study period observation district receives highest rainfall (675 mm) in the year 2007 and lowest rainfall (195.12 mm) in 2016.
North East Monsoon: North East Monsoon period is starts from October to November, and it is also called retreating of monsoon, it contributes 16 % of rainfall in the annual total and in post monsoon season district receives highest rainfall (390.23 mm) in the year 2005 and lowest rainfall (42.19 mm) in 2016. From 2001 to 2020 season wise and annual distribution of rainfall is shown in Figure 2
Meteorological Drought using SPI
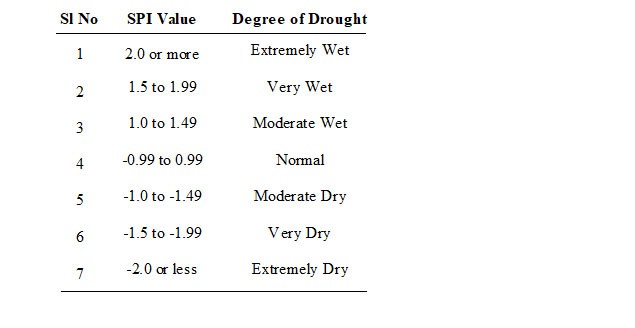
The Standardized Precipitation Index (SPI) is a drought index based on climatic data of a region. It was developed by Vicente-Serrano et al. in 2010 at Spain. According to SPI value degree of meteorological drought has been classified into seven categories such as Extremely wet, Very Wet, Moderate Wet. Normal, Moderate Dry, Very Dry and Extremely Dry.
In Chamarajanagara district from 2001 to 2020 according to Standardized Precipitation Index over 20 years Chamarajanagara taluk, Gundlupet taluk and Kollegal taluk has totally 17 years (2001,2003,2004,2005,2006,2007,2008,2009,2010,2011,2012,2013,2014,2015,2018,2019,2020) experienced moderate drought and 3 years (2002,2016,2017) experienced normal year it shows these three taluks has received normal magnitude of precipitation. Hanur taluk has totally 12 years (2003,2006,2007,2008,2009,2010,2011,2013,2015,2018,2019,2020) experienced moderate drought and 8 years (2001, 2002, 2004, 2005, 2012, 2014, 2016, 2017) experienced normal precipitation year. Yalandur taluk has totally 14 years (2001, 2004, 2005, 2006, 2007, 2008, 2009, 2010, 2011, 2013, 2014, 2015, 2018, 2019) experienced moderate drought and 6 years (2002, 2003, 2012, 2016, 2017, 2020) experienced normal precipitation year.
Conclusion
There is a large variation of rainfall distribution in both regional and temporal. Rainfall is the necessary meteorological parameter to describing the monsoon climate and it is a major component of the hydrological cycle of the earth ‘s climate structure. While studying the 20 years drought level most of the taluks experienced moderate level of drought in the study area.
Dr. Sowmya. R
Post-Doctoral Fellow (PDF)
DOS in Geography
Manasagangotri, University of Mysore
Dr. H Nagaraj
Professor
DOS in Geography
Manasagangotri,University of Mysore
Reference:
This paper provides information about the pattern of rainfall meteorological drought of Chamarajanagar district from 2001 to 2020. Rainfall is key factor to determine the meteorological drought. Rainfall is temporally and spatially very important for the welfare of the national economy. The average annual rainfall of any region is shows that the spatial variations. To identify the trend and pattern of rainfall analysis data has been collected from Indian Meteorological Department from 2001 to 2020 and Standardised Precipitation Index (SPI) has used for analysing the meteorological drought condition, and based on SPI value Chamarajangar district has experienced moderate drought condition from 2001 to 2020.
Introduction
Rainfall the primary factor to determine the sustainability and conservation of biodiversity means different living species on the earth. There is a large variation of rainfall distribution in both regional and temporal. Rainfall is the necessary meteorological parameter to describing the monsoon climate and it is a major component of the hydrological cycle of the earth ‘s climate structure. In India more than 75percent of rainfall in monsoon season from June to September, because the India is lying in tropical country and where water utilization completely depends on monsoon rainfall for the agricultural practices.
Objective
- To analyse the annual Rainfall pattern in the study area
- To identify the meteorological drought in the study area from 2001 to 2020
Chamarajanagar district belongs under southern zone of dry agro-climatic zone with geographical area of 569901 hectares. It lies between from 11º40'58'' to 12º06'32'' of North latitude and from 76º 24' 14'' to 77º 46' 55'' of East longitude. The Chamarajanagar district is stretched out in east – west direction. It comprises totally 5 taluks are Chamarajanagar, Gundlupet, Kollegal, Hanur and Yalandur and consists of 16 hoblies, 428 inhabited villages and 81 uninhabited villages.
Figure 1 Geographical Area of Chamarajanagar District
Materials and Method
To analyse and measure the meteorological drought from 2001 to 2020 in Chamarajanagara district Standardized Precipitation Index has used. Rainfall data has been collected from Indian Meteorological Department.
Results and discussion
To analyse the rainfall pattern 20 years has taken from 2001 to 2020 rainfall data from different rain gage stations of Chamarajanagar district. To study the trend and pattern of rainfall of the study areas rainfall has analysed season wise along with annual average rainfall
- Pre – Monsoon (March to May)
- Southwest Monsoon (June to September)
- Northeast Monsoon (October to December)
Table No 1. Season wise and Annual Distribution of Rainfall in Chamarajanagar District from 2001 to 2020
Pre-Monsoon: Pre monsoon season starts in March and ends in the month of May. This pre monsoon season is the onset period for monsoon in the study area and it contributes only 10 % of rainfall in the annual total. In this pre monsoon season district receives highest rainfall (158.20 mm) in the year 2006 and lowest rainfall (26.37 mm) in 2017
Southwest Monsoon: Monsoon season starts from June and continues up to end of September, total district receives highest amount of rainfall in these four month, and it contributes 74 % of rainfall in the annual total. In the study period observation district receives highest rainfall (675 mm) in the year 2007 and lowest rainfall (195.12 mm) in 2016.
North East Monsoon: North East Monsoon period is starts from October to November, and it is also called retreating of monsoon, it contributes 16 % of rainfall in the annual total and in post monsoon season district receives highest rainfall (390.23 mm) in the year 2005 and lowest rainfall (42.19 mm) in 2016. From 2001 to 2020 season wise and annual distribution of rainfall is shown in Figure 2
Figure 2: Season wise and Annual Distribution of Rainfall in Chamarajanagar District from 2001 to 2020
Meteorological Drought using SPI
The Standardized Precipitation Index (SPI) is a drought index based on climatic data of a region. It was developed by Vicente-Serrano et al. in 2010 at Spain. According to SPI value degree of meteorological drought has been classified into seven categories such as Extremely wet, Very Wet, Moderate Wet. Normal, Moderate Dry, Very Dry and Extremely Dry.
Table 2: Standardized Precipitation Index Value of Chamarajanagar District
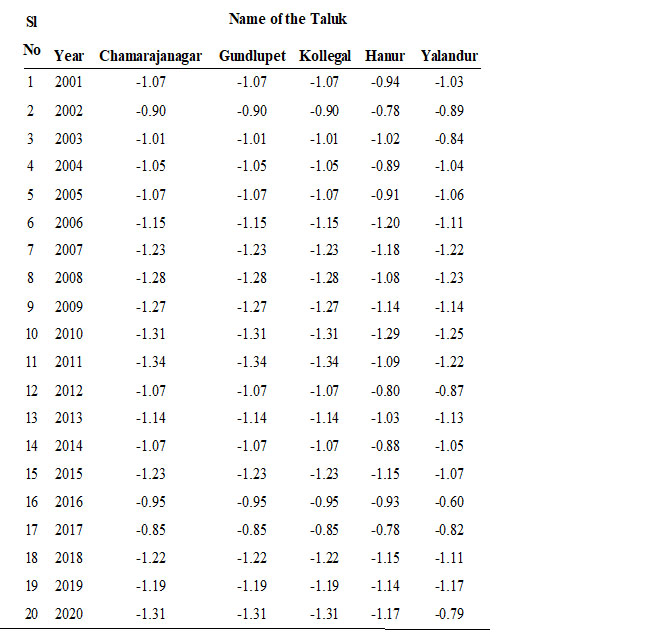
Table 3: Talukwise SPI Value of Chamarajanagar District from 2001 to 2020
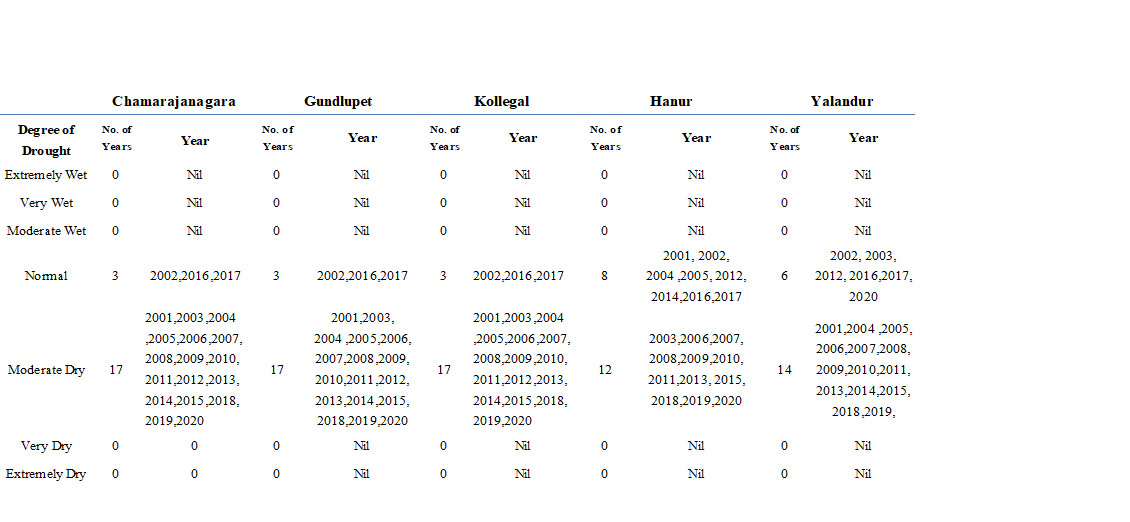
Table 4: Talukwise Drought Years in Chamarajanagar District
In Chamarajanagara district from 2001 to 2020 according to Standardized Precipitation Index over 20 years Chamarajanagara taluk, Gundlupet taluk and Kollegal taluk has totally 17 years (2001,2003,2004,2005,2006,2007,2008,2009,2010,2011,2012,2013,2014,2015,2018,2019,2020) experienced moderate drought and 3 years (2002,2016,2017) experienced normal year it shows these three taluks has received normal magnitude of precipitation. Hanur taluk has totally 12 years (2003,2006,2007,2008,2009,2010,2011,2013,2015,2018,2019,2020) experienced moderate drought and 8 years (2001, 2002, 2004, 2005, 2012, 2014, 2016, 2017) experienced normal precipitation year. Yalandur taluk has totally 14 years (2001, 2004, 2005, 2006, 2007, 2008, 2009, 2010, 2011, 2013, 2014, 2015, 2018, 2019) experienced moderate drought and 6 years (2002, 2003, 2012, 2016, 2017, 2020) experienced normal precipitation year.
Conclusion
There is a large variation of rainfall distribution in both regional and temporal. Rainfall is the necessary meteorological parameter to describing the monsoon climate and it is a major component of the hydrological cycle of the earth ‘s climate structure. While studying the 20 years drought level most of the taluks experienced moderate level of drought in the study area.
Dr. Sowmya. R
Post-Doctoral Fellow (PDF)
DOS in Geography
Manasagangotri, University of Mysore
Dr. H Nagaraj
Professor
DOS in Geography
Manasagangotri,University of Mysore
Reference:
Dipanwita Dutta a , Arnab Kundu b, N.R. Patel c , S.K. Saha c , A.R. Siddiqui 2015 Assessment of agricultural drought in Rajasthan (India) using remote sensing derived Vegetation Condition Index (VCI) and Standardized Precipitation Index (SPI) Journal of The Egyptian Journal of Remote Sensing and Space Sciences pp no 54 to 63
A.T.M. J. Alam, A.H.M. Saadat, M.S. Rahman, 2011 Spatial Analysis of Rainfall Distribution and Its Impact on Agricultural Drought at Barind Region, Bangladesh Journal of environmental science pp no 41 to 50
Bashar Muneer Yahya and Dursun Zafer Seker 2018 The Impact of Dust and Sandstorms in Increasing Drought Areas in Nineveh Province, North-western Iraq Journal of Asian and African Studiespp no 2 to 14
N. R. Patel,a P. Choprab and V. K. Dadhwala 2007 Analyzing spatial patterns of meteorological drought using standardized precipitation index Journal of Royal Meteorological Society pp no 330 to 336
Toma Rani Saha, Pallav K Shrestha, Oldrich Rakovec, Stephan Thober and Luis Samaniego1,2021 A drought monitoring tool for South Asia Journal of Environmental Research pp no 4 to 14
U Ma’rufah R, Hidayat, I Prasasti 2017 Analysis of relationship between meteorological and agricultural drought using standardized precipitation index and vegetation health index Journal of Earth and Environmental Science series pp no 1 to 7.

Open Access
Filling the gap between research and communication ARCC provide Open Access of all journals which empower research community in all the ways which is accessible to all.

Products and Services
We provide prime quality of services to assist you select right product of your requirement.

Support and Policies
Finest policies are designed to ensure world class support to our authors, members and readers. Our efficient team provides best possible support for you.

